Results
This article synthesises the results obtained within Actions 1.1 and 1.2 of Axis 1 of the OBLA (Dynamics of species and communities in relation to environmental factors) and produced as part of the OBLA implementation project (with the exception of temporal trends in rooted vegetation abundance, produced during a student project within the framework of the "BD Biodiv" project).
Action 1.1: Palaeobiodiversity and Environmental Factors
One of the objectives of Action 1.1 is the production of an inventory and the improvement of palaeoecological, primarily palaeobiological, knowledge along the entire upstream-downstream gradient of the Loire and its catchment area.
Paléobotany
The majority of the data concerns the upstream part of the Loire watershed and essentially consists of paleobotanical data (more rarely paleolimnological data). A multivariate analysis methodDetrended Correspondence Analysiswas carried out on a portion of the available data.
This method highlighted the significant influence of human activity on the composition of plant communities and their growth over time. A comparison also revealed that human activity began earlier in the downstream areas compared to the upstream areas.
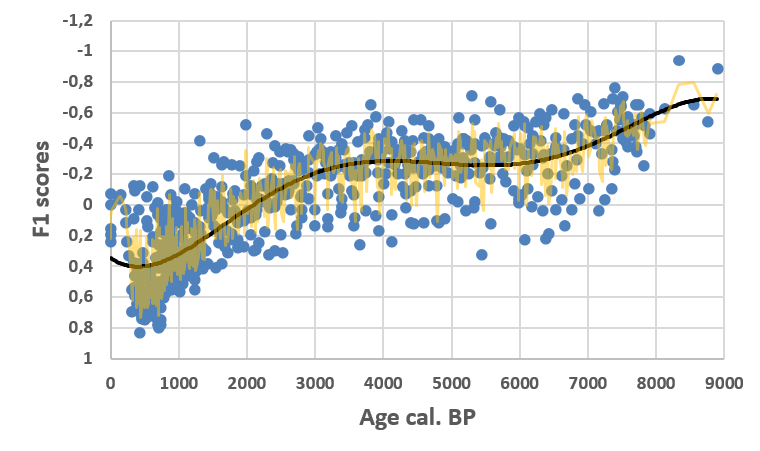
Temporal evolution on the lower Loire (in calibrated years Before Present) of pollen survey scores on axis F1 (negatively correlated with human impact). The black line shows the 5th-order polynomial trend curve. The orange line shows the 2nd-order moving average.
Action 1.2: Trends in species and community dynamics in the recent past
The objectives of Action 1.2 are multiple: to compile a list of species present on the Loire floodplain, to assess species abundance over time (trend analysis), and to link these trends to environmental parameters (meteorological, physico-chemical, biological factors, etc.).
Phytoplankton
The records from 24 stations were used to establish the list of observed taxa, most of which correspond to surveys carried out by the Bi-Eau studies office on behalf of the Loire-Bretagne Water Agency between 1991 and 2001 and then from 2005 to 2011. For the spatio-temporal trend analysis, 6 stations were used over an 18-year period.
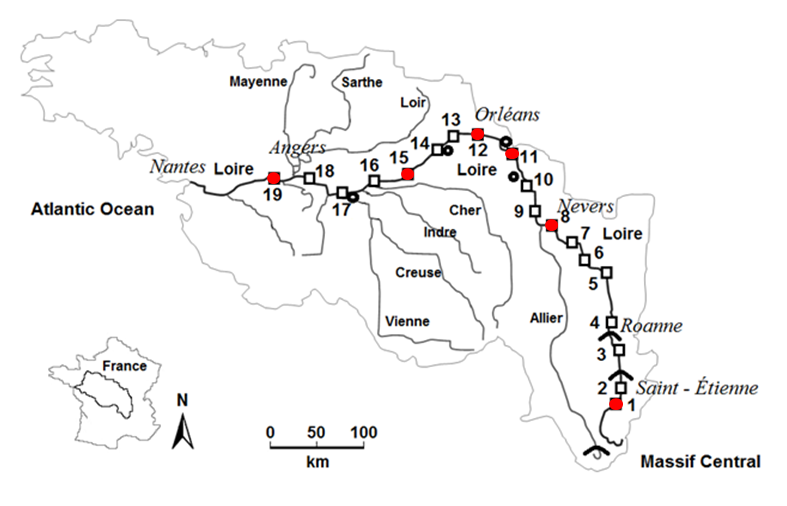
Location of phytoplankton sampling stations along the Loire. Stations selected for temporal trend analysis are shown in red.
Nearly 710 taxa were recorded across all sites, with approximately 40% of these belonging to the class Chlorophyta, 30% to the class Diatomophyta and 11% to the class Cyanobacteria.
If no longitudinal gradient of taxonomic richness is detected, it appears to be higher during the second sampling period, largely due to the increased identification effort and taxonomic changes. Intra-annual variability also appears to have increased, potentially in response to more dynamic flow rates.
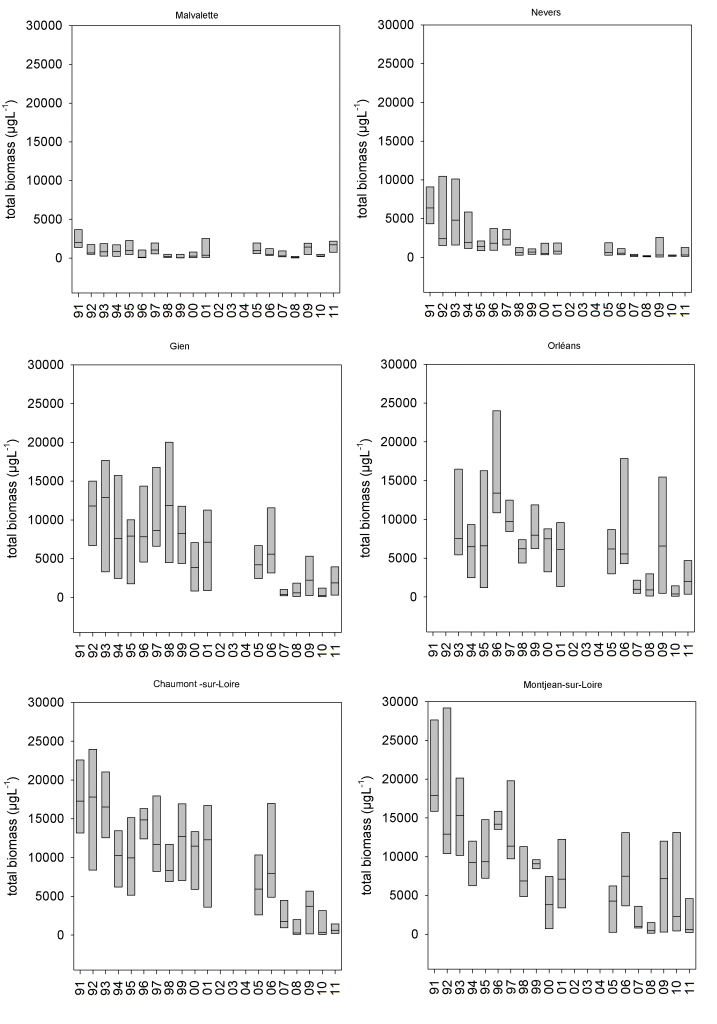
Increase in total phytoplankton biomass at the 6 stations considered between 1991 and 2011
Regarding biomass, this is gradually declining across all stations. Several potential explanations for this decline are being considered: a decrease in dissolved phosphorus, filtration by an invasive bivalve, the presence of toxic elements from agriculture, and rising temperatures favouring smaller forms, etc.
Rooted vegetation
Over a million records (1,019,112) of vascular flora from three National Botanical Conservatories (Paris Basin, Brest and Massif Central) have been collected. These correspond to observations made in a municipality crossed by the River Loire or one of its tributaries. The majority (671) relate to data from after 1999, and only 51 to the period before 1950. Data on aquatic macrophytes collected as part of the surface water quality monitoring and surveillance network (RCS) have also been added.
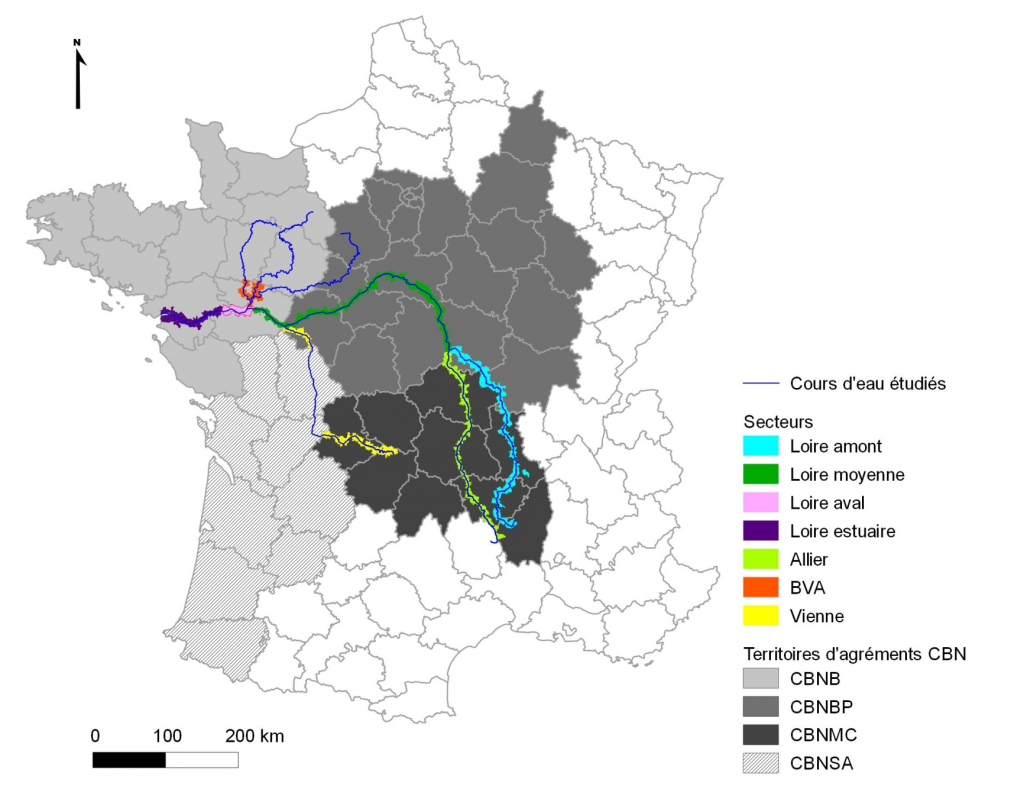
Areas of study for rooted vegetation
The temporal evolution of the number of records and species per municipality is analysed using a generalised linear mixed model (GLMM). The comparison of the number of records and species per sector (7 sectors in total) is carried out using a Kruskal-Wallis test followed by a pairwise multiple comparison test. Finally, the analysis of temporal trends is carried out on 93 species by comparing historical data from 17 Floras with data from CBNs through the study of linear regression residuals between recent and historical data.
Nearly 2437 species are present in the data from the CBNs, with the largest number of species detected on the upper Loire and the Allier. The Allier appears to be better surveyed than the other sectors, while the Vienne and the Basses Vallées Angevines are less so. The data from the RCS comprises 113 taxa, including 20 taxa of algae, 19 species of bryophytes, and 69 vascular taxa.
In terms of temporal evolution, ancient abundances are close to recent ones. Indeed, only 27 out of the 93 species studied show a significant trend, and for 20 of these, this difference between recent and historical data concerns only a single ancient flora.
A Co-Inertia analysis will need to be used subsequently to study the distribution of assemblages as a function of environmental variables, whereas various exploratory analyses are proposed for the distribution of species.
Benthic macroinvertebrates
Annual surveys of benthic macroinvertebrates have been conducted on the Loire River since 1977 using various protocols and levels of identification. Data from 319 surveys across 51 stations have been collected. Only 27 stations belonging to the Water Quality Monitoring and Surveillance Network (RCS) are used for analysing distribution along the longitudinal gradient of the Loire, due to finer identification (to genus, not family level).
A total of 310 taxa representing 128 families (of which 69% belong to the class Insecta) were recorded in the data collected.
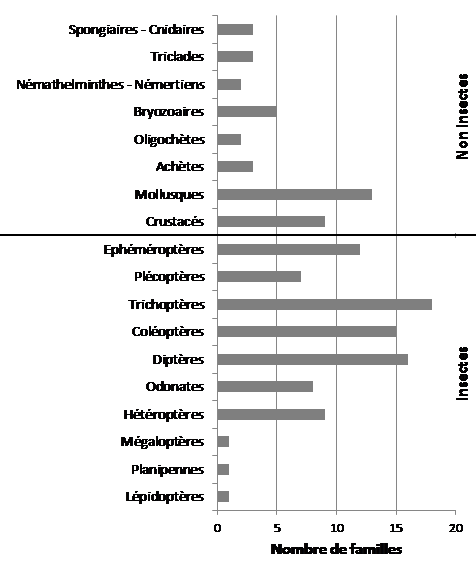
Distribution of benthic macroinvertebrate families in the Loire
Of the 222 taxa observed at the 27 RCS monitoring sites, the Upper Loire (from Le Puy-en-Velay to Bec d’Allier) is the section with the highest taxonomic richness, with 181 taxa (relative diversity of 80.1%), whilst the Lower Loire (from Bec de Vienne to the salinity limit) is the least diverse sector with 87 taxa (relative diversity of 38.5%).
An increase in invasive species is also observed.
Land arthropods
A synthesis of 9790 terrestrial macro-arthropod data from various organisations (GRETIA, MNHN, etc.) has been carried out. This data specifically concerns Aranea and beetles Carabidae, taxonomic groups indicative of biodiversity. Different data analysis methods have been implemented to answer all the research questions: Multiple Correspondence Analysis (MCA), Correspondence Factor Analysis (CFA), Hierarchical Ascendant Classification (HAC) and linear regression.
The data collected comprises a total of 536 spider species over a period of approximately 20 years, and nearly 200 species are specific to a single sector (downstream, upstream and headwaters). Species richness appears to decrease from downstream to upstream, although the trend is not significant. However, species richness of halophilic species decreases significantly from downstream to upstream.
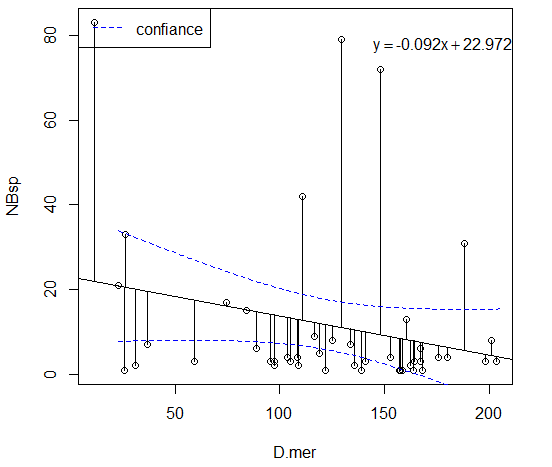
Linear regression of specific richness in Aranaea by site as a function of distance to the sea
Regarding beetles Carabidae285 different species were identified over a period of approximately 10 years. The vast majority of these species (168) are exclusive to the upstream sector and only 15 species are common to all three sectors.
For both groups studied, each set of highlighted records appears to correspond to a species assemblage, with both species exclusive to a given area and species common to the different units. The Barber pitfall trapping method, whose results differ from those of other methods (beating, sweeping, visual observation), seems most appropriate for long-term monitoring.
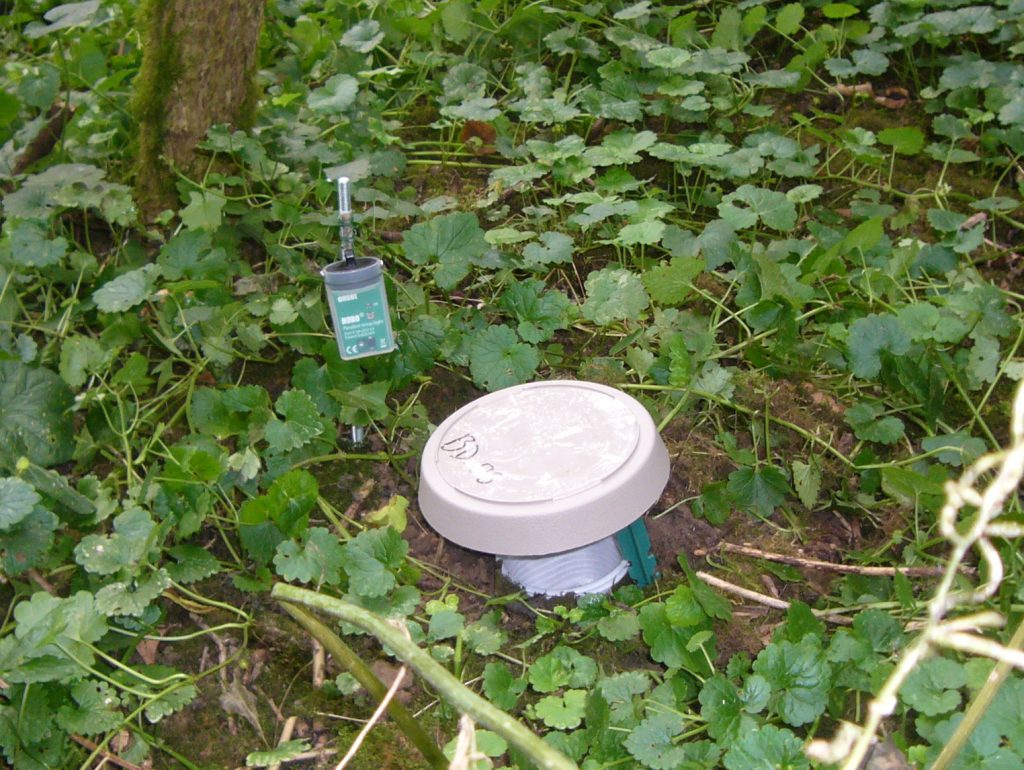
Barber trap capture device coupled with a temperature recorder
Avifauna
Three bird monitoring programmes have been identified to carry out the analyses: the Loire basin estuary breeding bird observatory, the temporal monitoring of riverine breeding birds, and various grassland bird studies.
These data have allowed for the identification of 312 bird species in the territory. The decrease in numbers of species linked to scrubland and the increase in populations of forest species tend to show a development of the riparian forest.
Resources
Download the report on the OBLA implementation project
Download the student project report on vegetation time series analysis
Contacts:
Scientific coordinator: Sabine Greulich, UMR Université de Tours - CNRS 7324 CITERES (greulich@univ-tours.fr)
Data analysis and management: Fabien Verniest, UMR Université de Tours - CNRS 7324 CITERES (fabien.verniest@univ-tours.fr)